Seiri Quickstart
Seiri allows you to monitor webhooks and scheduled tasks instantly.
No projects or environments — just create a webhook and start observing events in real time.
Choose the type of webhook: Immediate, Scheduled, or Periodic.
1. Sign in to the Dashboard
- Open the Seiri Dashboard.
- Sign in using Google or GitHub SSO.
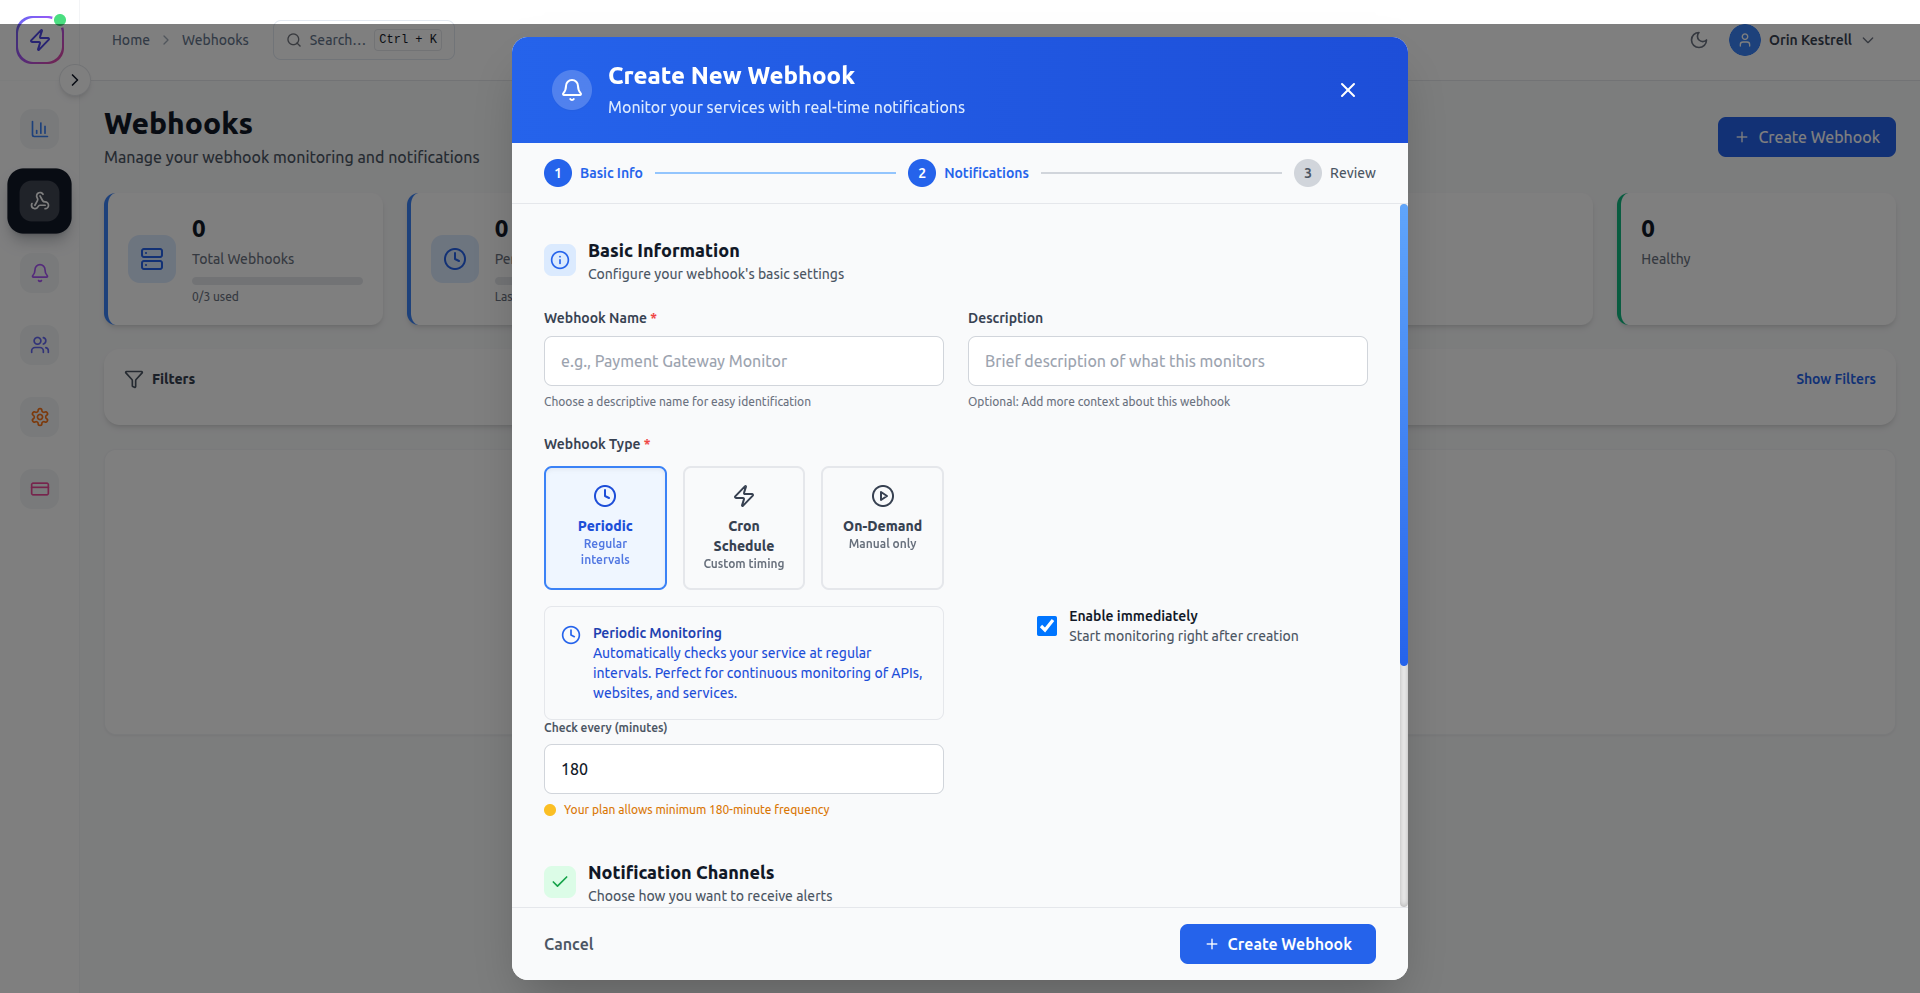
2. Create a Webhook
-
Navigate to Webhooks → Add Webhook.
-
Enter a descriptive name (e.g.,
Payment Events). -
Select the webhook type:
- Immediate — triggered when an event occurs
- Scheduled — triggered at a specific time
- Periodic — triggered at fixed intervals
- Copy the Seiri receiver URL.
- Send events to this URL to start monitoring.
3. Send Your First Event
Send a test event to verify everything works.
Example (cURL)
curl -X POST https://cloud.seiri.app/abcf:1234/success \
     -H "Content-Type: application/json" \
     -d '{"event": "payment_succeeded"}'
Seiri automatically logs every request, response, and delivery status.
4. Monitor Scheduled Jobs (Optional)
You can monitor cron jobs or background workers by sending a POST request on every execution.
Example (Node.js)
import fetch from 'node-fetch';

async function myJob() {
  await fetch('https://cloud.seiri.app/abcf:1234/success', {
    method: 'POST',
    headers: { 'Content-Type': 'application/json' },
    body: JSON.stringify({
      status: 'success',
      timestamp: Date.now(),
    }),
  });
}

myJob();
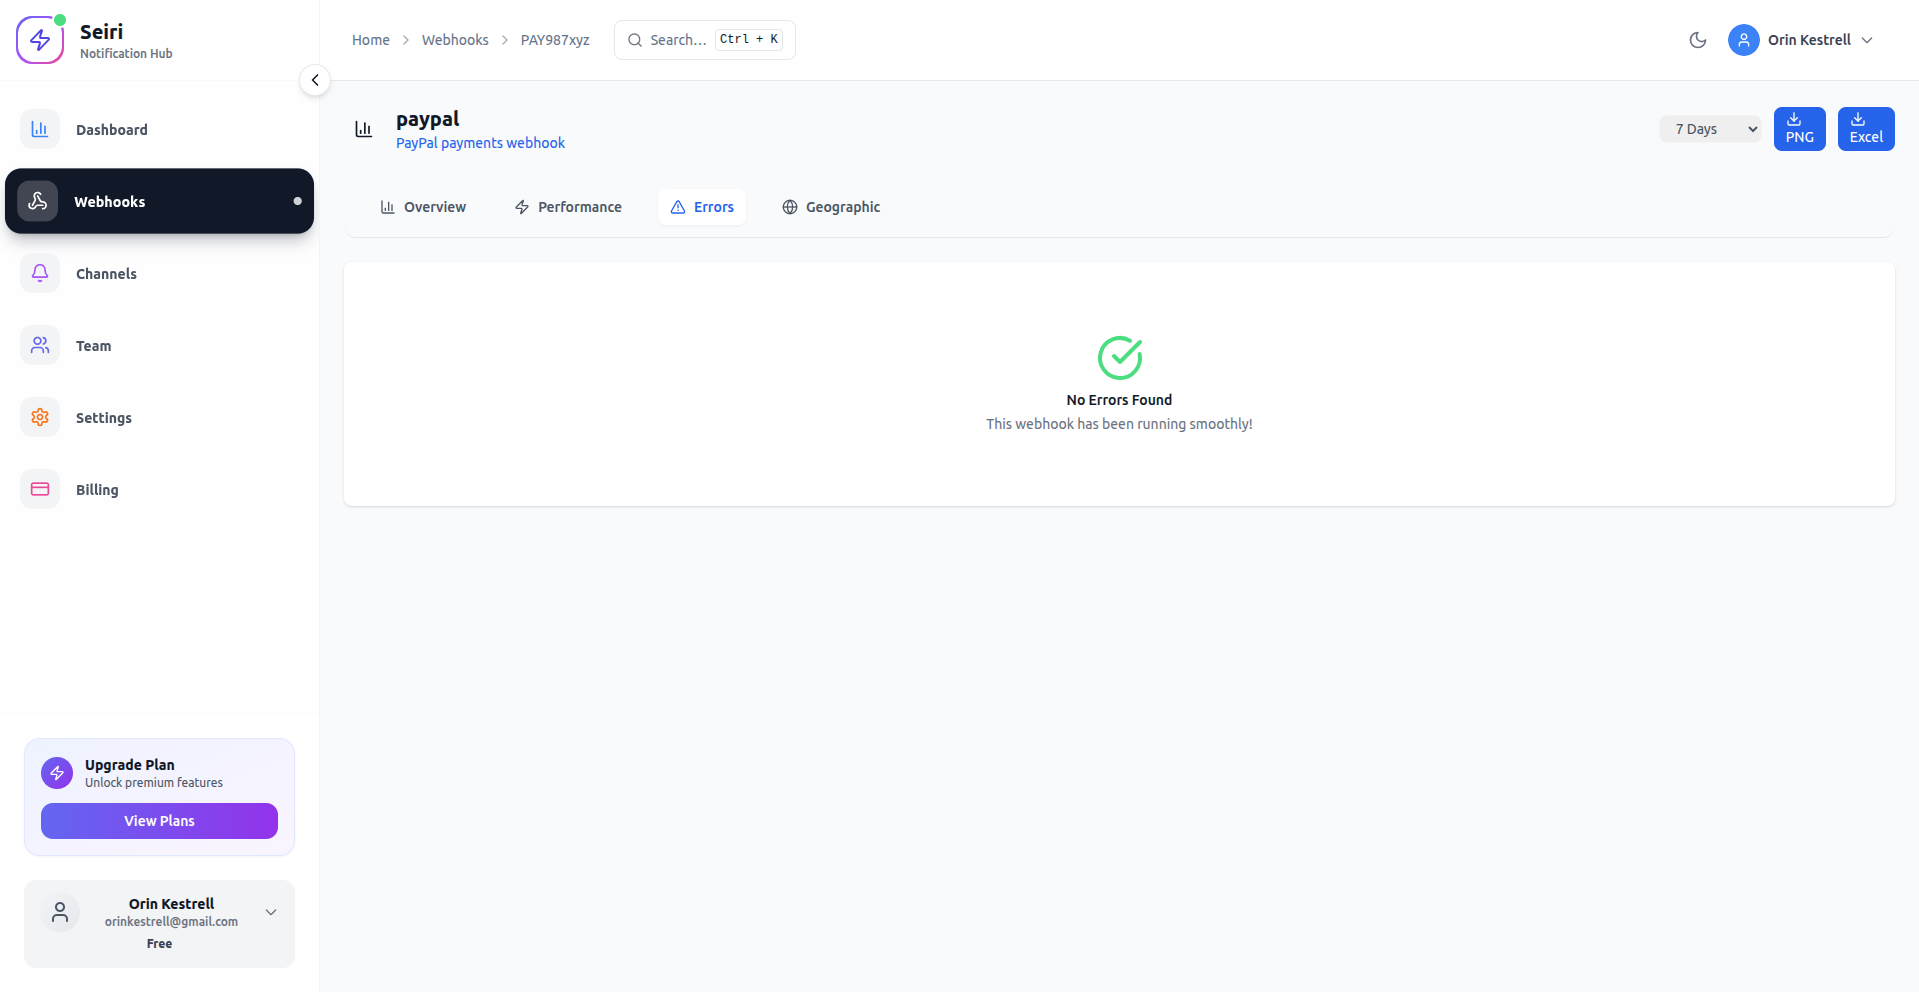
5. Inspect Logs & Events
-
Open your webhook from the dashboard.
-
Navigate to Insights → Event Logs.
-
Inspect:
- Request & response bodies
- Headers
- Status codes
- Retry attempts
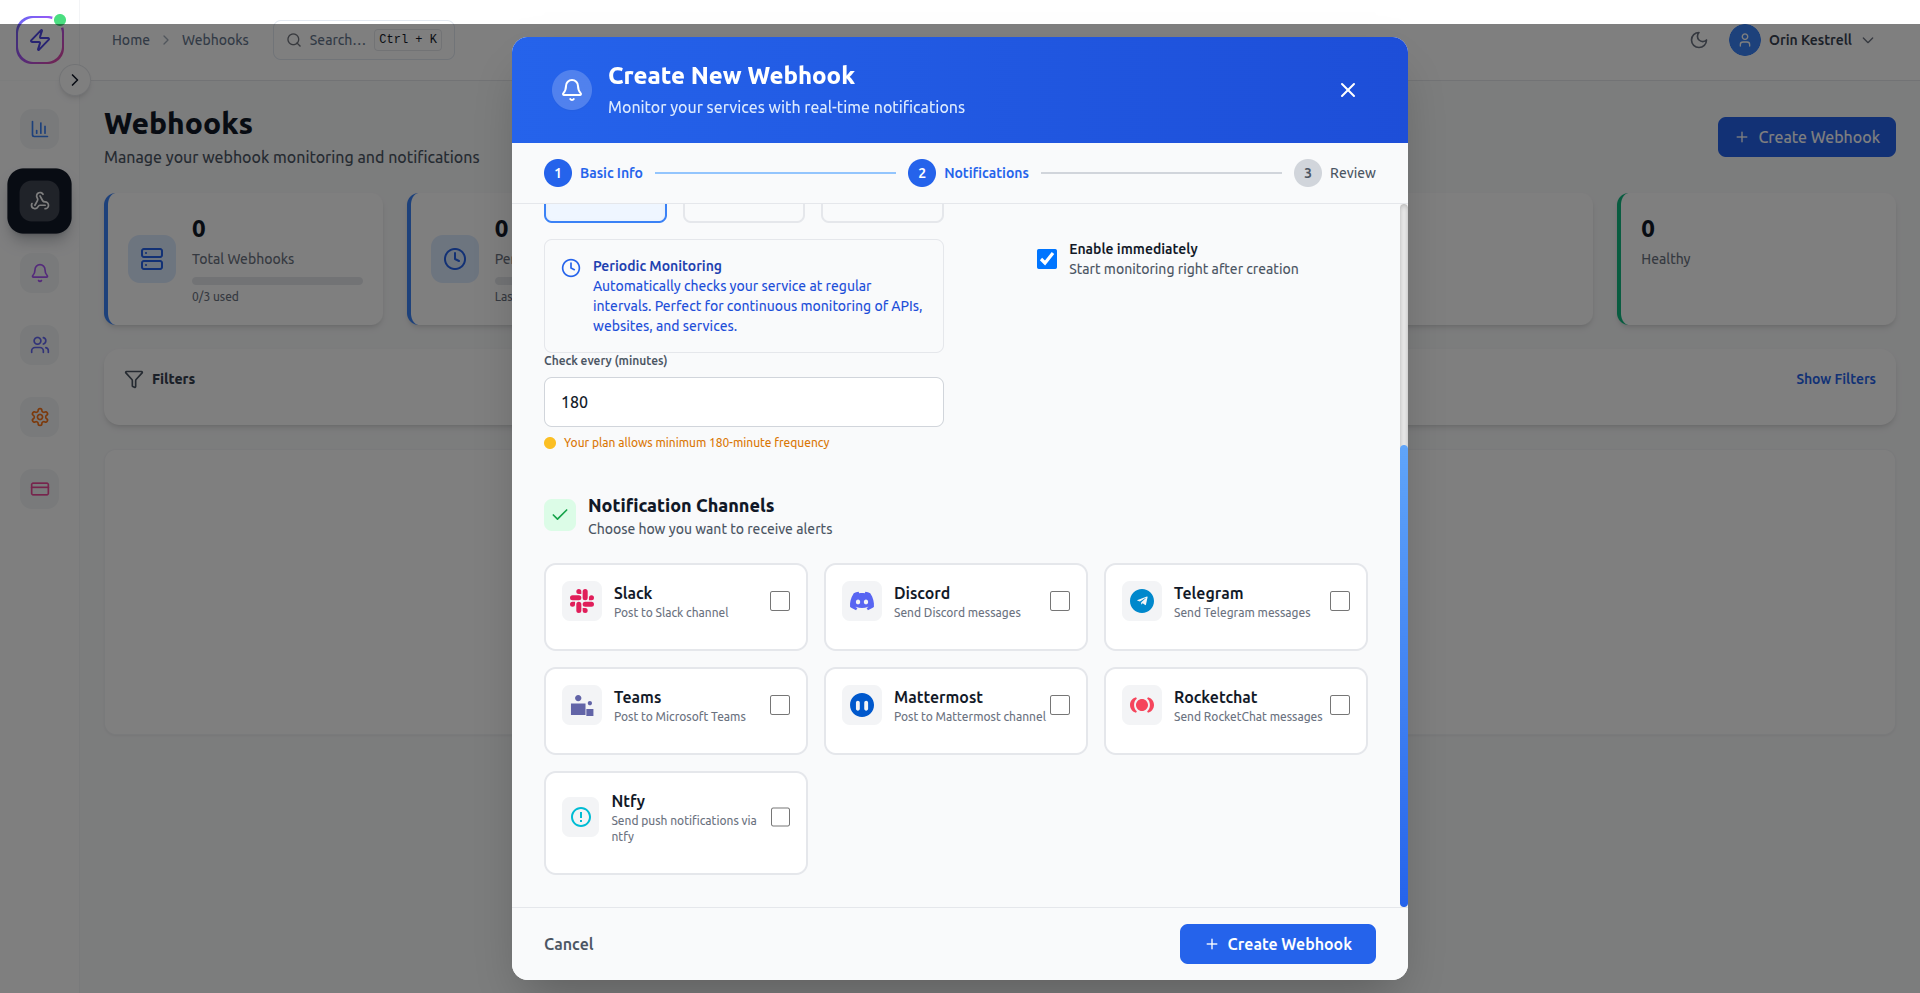
6. Set Up Alerts
-
Click Add Alert on your webhook.
-
Define conditions:
- Failed deliveries
- Latency thresholds
-
Choose notification channels:
- Slack
- Discord
- Teams
- Telegram
- Ntfy
- Webhook
Alerts notify you before users notice issues.
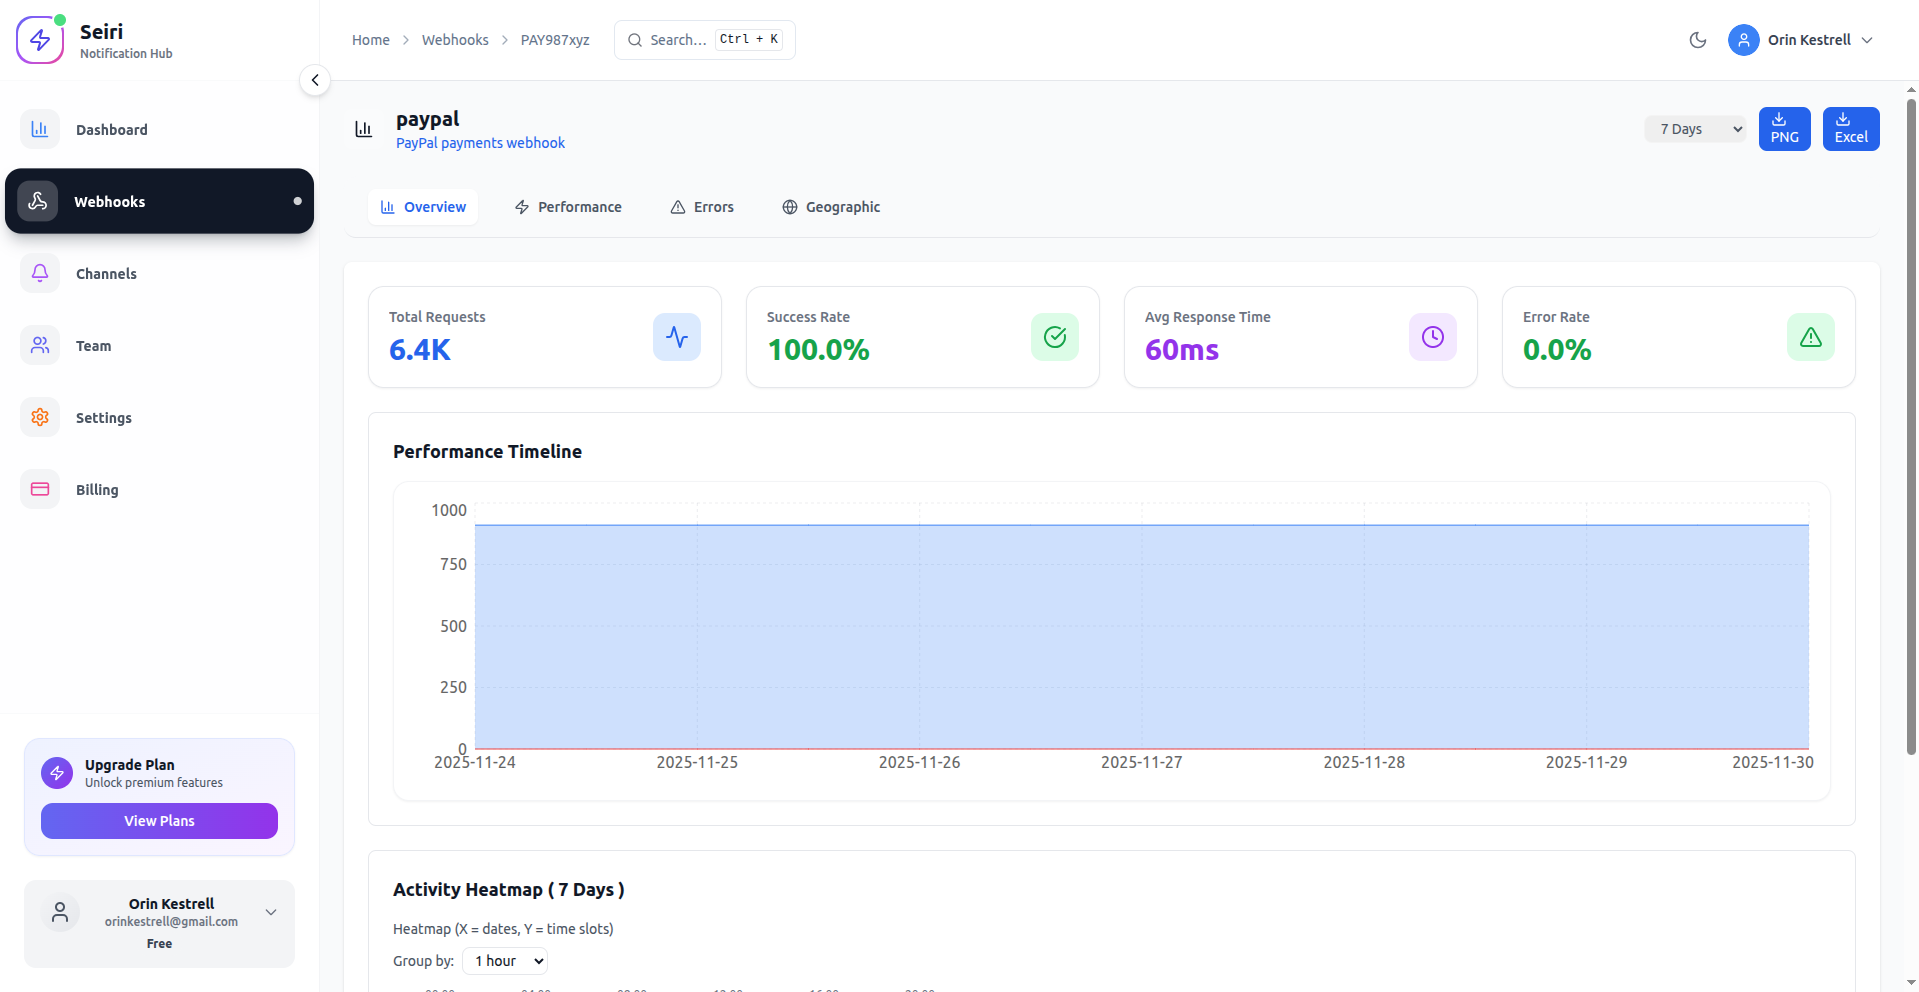
7. Insights & Analytics
The Insights Dashboard gives you a high-level view of reliability and performance.
Next Steps
- Explore Use Cases to see real-world monitoring patterns.
- Configure alerts and filters for critical workflows.
- Use Insights & Analytics to improve reliability and delivery performance.