The 3 AM Wake-up Call That Changed Everything: Why We Built Seiri
The story behind Seiri's creation and how webhook monitoring can save you from those dreaded middle-of-the-night emergency calls.
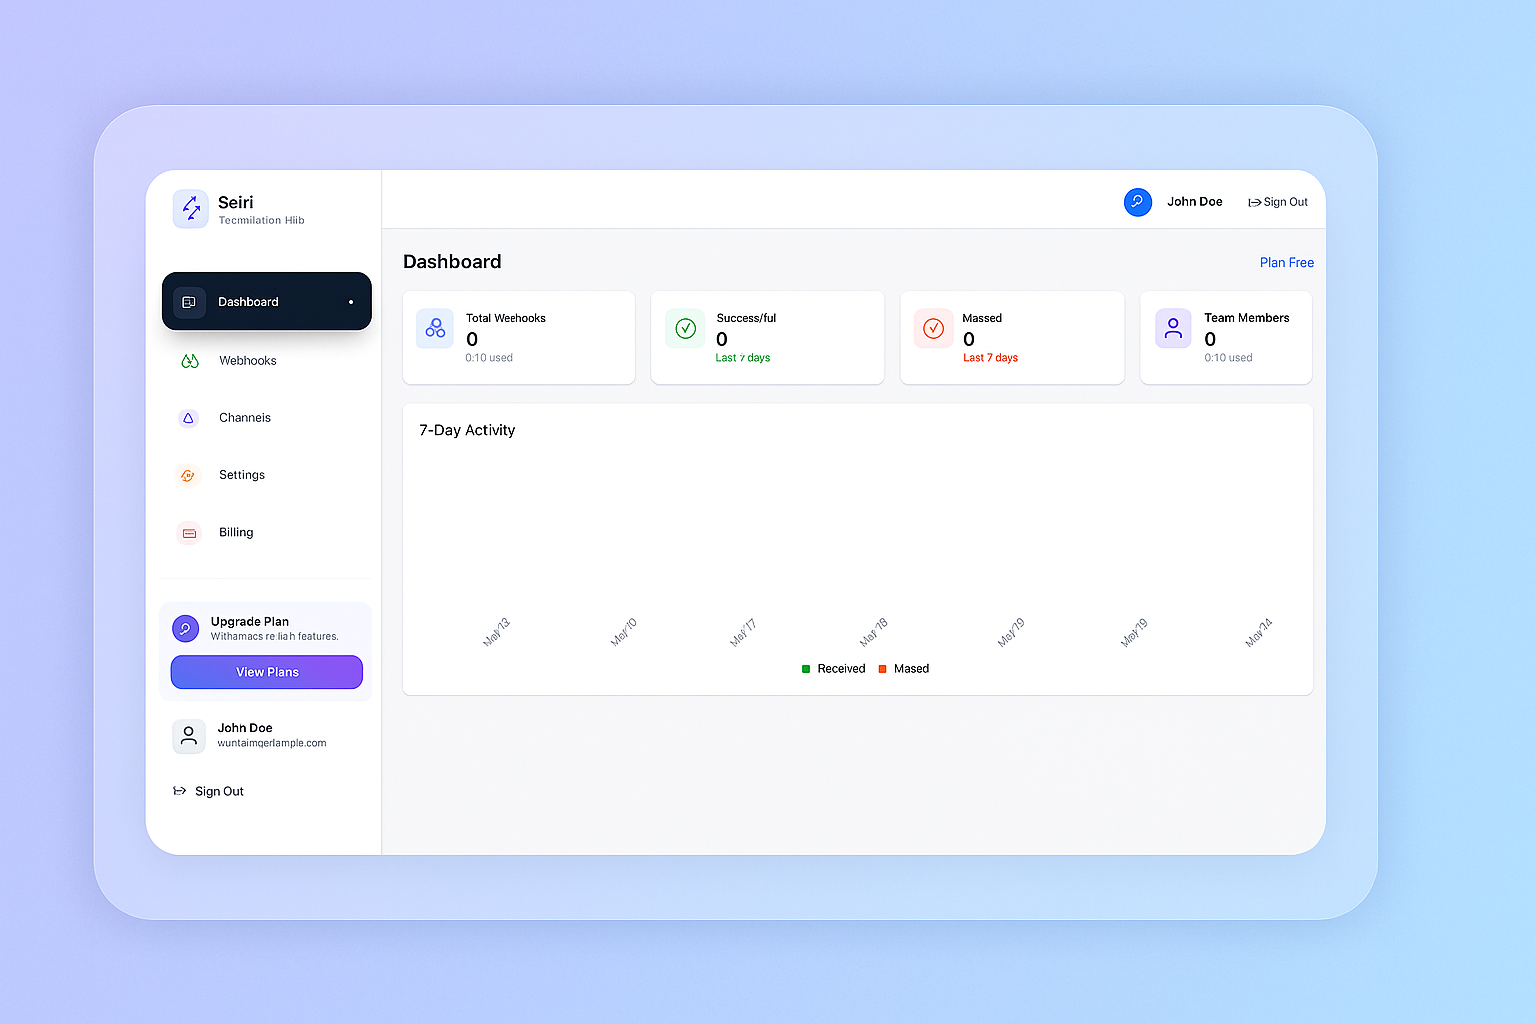
 The Seiri dashboard - your command center for webhook and cron job monitoring
The 3 AM Wake-up Call That Changed Everything
It was 3:47 AM on a Tuesday when my phone buzzed with a Slack notification that made my heart sink: “Payment processing down for 2 hours. Customers can’t complete purchases.”
Two hours. Our critical payment webhook had been failing silently for two hours, and we only found out when angry customers started flooding our support channels. That night, we lost $47,000 in revenue and countless hours of sleep trying to restore service.
Sound familiar? If you’re nodding your head, you’re not alone. This exact scenario happens to thousands of companies every day, and it’s precisely why we built Seiri.
The Silent Killer: Failed Webhooks Go Unnoticed
 Every minute of undetected failure compounds the damage to your business
Here’s the uncomfortable truth: your critical systems are failing right now, and you probably don’t know it.
- Your nightly data backup script? It’s been skipping files for a week.
- That payment processor webhook? It timed out 47 times yesterday.
- Your user onboarding emails? They stopped sending three days ago.
Traditional monitoring tools focus on servers and databases, but they miss the invisible threads that hold your application together: webhooks, scheduled jobs, and background processes.
What Makes Webhook Monitoring Different?
Webhook monitoring isn’t just about “is my server up?” It’s about “are my business processes actually working?”
The Three Pillars of Webhook Health
1. Reliability Monitoring
- Did the webhook actually receive the request?
- Did it process without errors?
- Did it complete within the expected timeframe?
2. Speed & Performance
- Are response times trending upward?
- Is your webhook keeping up with traffic spikes?
- Are timeouts becoming more frequent?
3. Business Logic Validation
- Is the webhook returning the correct response format?
- Are all required fields present in the payload?
- Is the business logic actually executing correctly?
The Seiri Philosophy: Organized Monitoring
Seiri (整理) - The Japanese art of organization applied to system monitoring
Our name comes from Seiri (整理), the Japanese concept of organizing and tidying. Just as a cluttered workspace leads to inefficiency and mistakes, disorganized monitoring leads to system failures and downtime.
We believe that clean, organized monitoring leads to:
- ✨ Faster incident response (minutes, not hours)
- 🎯 Proactive problem detection (before customers notice)
- 😴 Better sleep (no more 3 AM panic calls)
- 💰 Protected revenue (catch payment failures instantly)
How Seiri Transforms Your Monitoring Game
Before Seiri: The Chaos
# Your current monitoring setup (probably)
*/5 * * * * curl -s https://yourapp.com/health || echo "maybe broken?"
After Seiri: Organized Excellence
With Seiri, you get:
🔍 Intelligent Monitoring
- Smart retry logic that distinguishes between network hiccups and real failures
- Customizable success criteria (not just HTTP 200)
- Geographic monitoring from multiple regions
📱 Instant Alerts That Matter
- Multi-channel notifications (email, Slack, SMS, Discord)
- Smart escalation rules
- Alert grouping to prevent notification fatigue
📊 Actionable Insights
- Beautiful dashboards that actually help you make decisions
- Trend analysis to catch problems before they become critical
- Detailed failure analysis with request/response logging
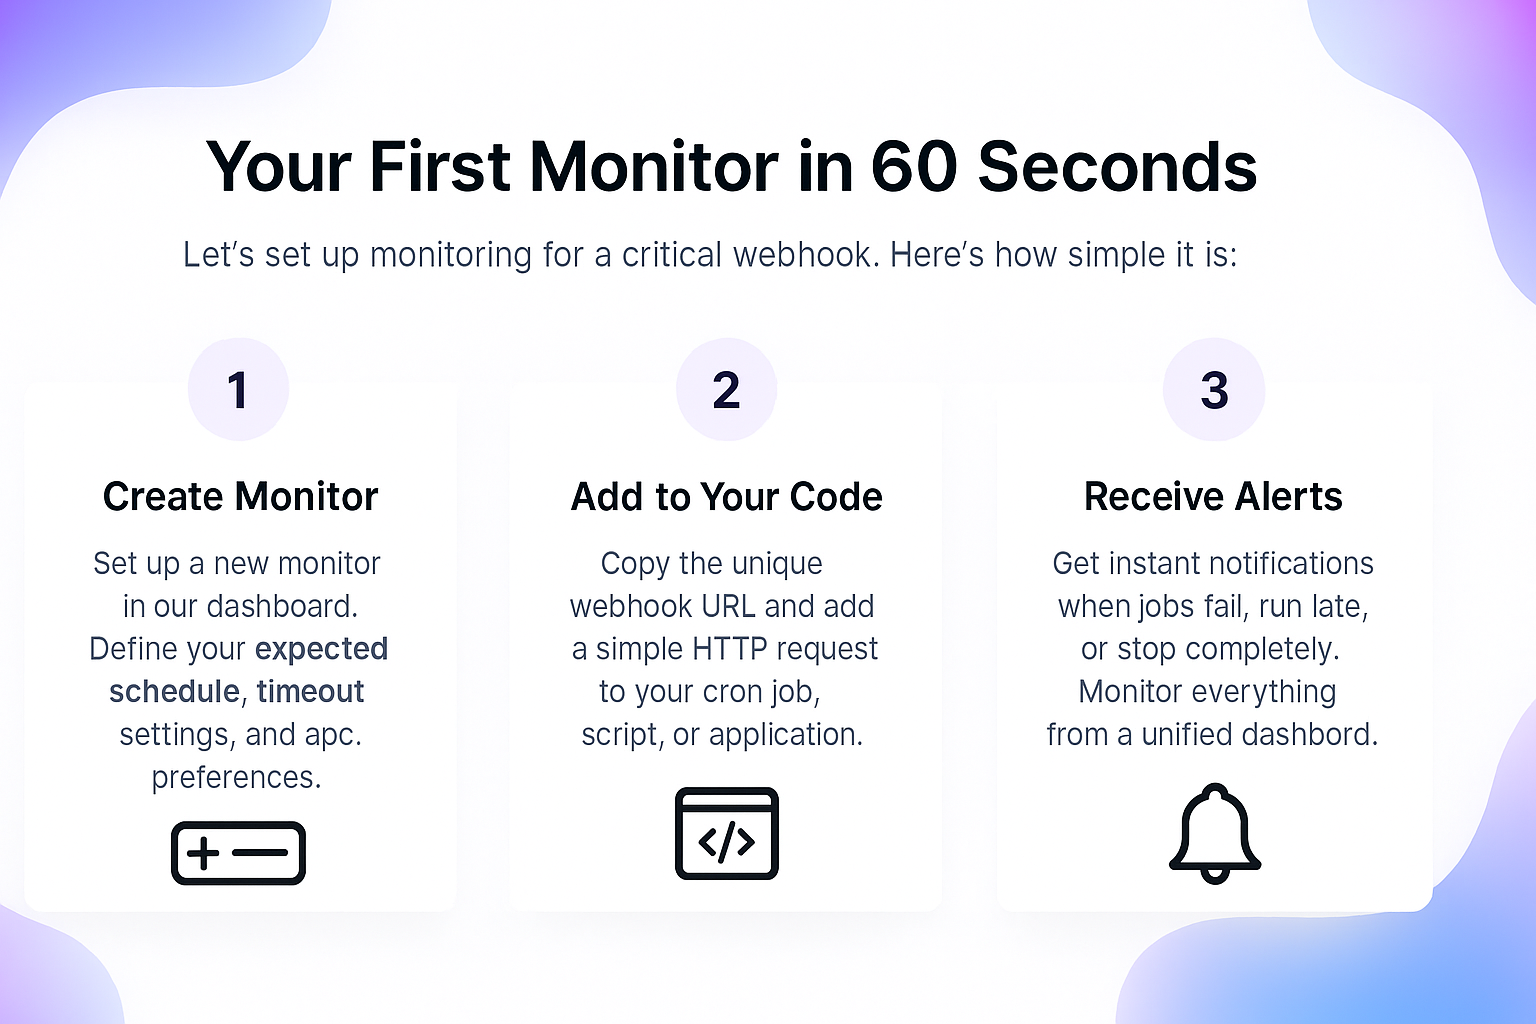
Your First Monitor in 60 Seconds
Let’s set up monitoring for a critical webhook. Here’s how simple it is:
Real Results from Real Companies
“Seiri caught a critical payment processing failure that would have cost us $200K in lost revenue. It paid for itself in the first week.”
— Sarah Chen, CTO at TechFlow
“We went from discovering issues through customer complaints to preventing them entirely. Our MTTR dropped from 4 hours to 12 minutes.”
— Marcus Rodriguez, DevOps Lead at DataSync
Average Results with Seiri:
- ⚡ 89% faster incident detection
- 💰 $127K annual revenue protection
- 😴 73% reduction in after-hours incidents
- 🎯 99.9% uptime for critical processes
Beyond Basic Monitoring: Advanced Seiri Features
Cron Job Monitoring
Not just webhooks! Monitor any scheduled task:
- Backup scripts
- Data sync jobs
- Report generation
- Cache warming tasks
API Health Monitoring
Track the health of your third-party integrations:
- Payment processors (Stripe, PayPal)
- Email services (SendGrid, Mailgun)
- Analytics platforms (Mixpanel, Amplitude)
- Authentication providers (Auth0, Firebase)
Team Collaboration Features
- Incident Timelines: See exactly what happened and when
- Runbook Integration (WIP Q2/2026): Link alerts to resolution procedures
- Status Pages (WIP Q2/2026): Keep stakeholders informed automatically
- Postmortem Tools (WIP Q4/2026): Learn from incidents and prevent repeats
The Cost of Not Monitoring
Let’s be honest about what’s at stake:
For a $1M ARR SaaS company:
- 1 hour of payment downtime = $2,740 in lost revenue
- 1 day of email delivery failure = $8,220 in lost conversions
- 1 week of silent backup failures = Priceless data (and your job)
Seiri costs $29/month. One prevented incident pays for itself for the entire year.
Getting Started: Your Monitoring Transformation
Ready to sleep better at night? Here’s your roadmap:
Week 1: Foundation
- Sign up for Seiri (free 14-day trial)
- Monitor your top 3 critical webhooks
- Set up basic alerting for your team
Week 2: Expansion
- Add cron job monitoring for scheduled tasks
- Configure escalation rules for different severity levels
- Set up team dashboards for visibility
Week 3: Optimization
- Fine-tune alert thresholds based on real data
- Add business logic validation for complex workflows
- Create runbooks for common incident types
Month 2+: Mastery
- Implement advanced monitoring patterns
- Build custom integrations with your existing tools
- Share knowledge with other teams in your organization
Start Your Organized Monitoring Journey Today
Don’t wait for your own 3 AM wake-up call. The next time a critical system fails, make sure you’re the first to know — not your customers.
Start Your Free 14-Day Trial →
✅ No credit card required
✅ Setup in under 5 minutes
✅ Monitor unlimited webhooks
✅ Full feature access
Questions about webhook monitoring or Seiri? Email us — we love talking about monitoring (yes, really!).
Ready to organize your monitoring?
Join hundreds of teams who’ve already transformed their incident response with Seiri.